MAKE A MEME
View Large Image

| View Original: | 2006Australian exports.svg (853x432) | |||
| Download: | Original | Medium | Small | Thumb |
| Courtesy of: | commons.wikimedia.org | More Like This | ||
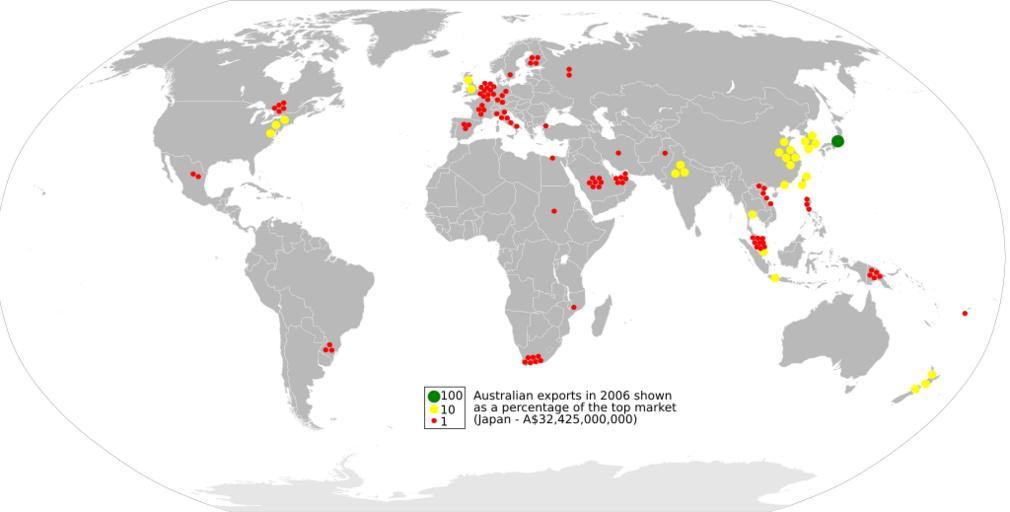
| Keywords: 2006Australian exports.svg bubble map shows the global distribution of Australian exports in 2006 as a percentage of the top market Japan - A 32 425 000 000 This map is consistent with incomplete set of data too as long as the top market is known It resolves the accessibility issues faced by colour-coded maps that may not be properly rendered in old computer screens Own work Derived from 45px File 2006Australian exports PNG by Anwar saadat cflm <small> talk </small> 2009-08-28 thumb left Original PNG version Economic charts of Australia Trade maps of the world Maps of the world indicating regions International relations maps of Australia Bubble maps | ||||