MAKE A MEME
View Large Image

| View Original: | Access to drinking water in third world.svg (320x240) | |||
| Download: | Original | Medium | Small | Thumb |
| Courtesy of: | commons.wikimedia.org | More Like This | ||
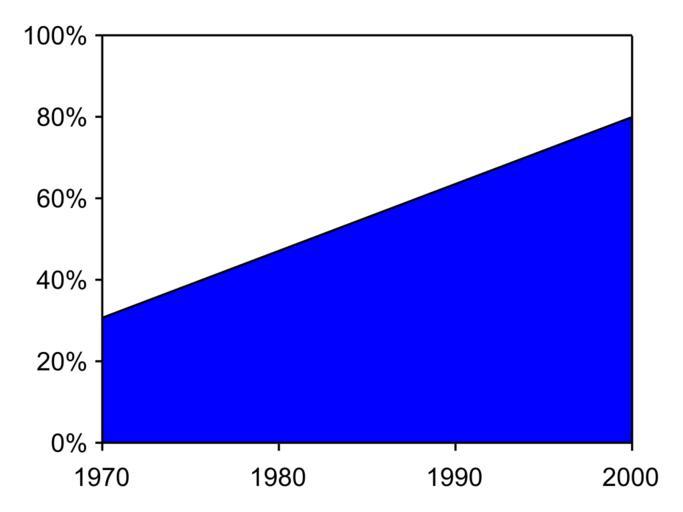
| Keywords: Access to drinking water in third world.svg The line on this graph is not the same as the original http //web archive org/web/20090225074856/http //www lomborg com/dyn/files/basic_items/69-file/skeptenvironChap1 pdf page 22 validSVG Adobe Illustrator en Best estimate of the share of people in developing countries with access to drinking water 1970 2000 Vectorised from File Access to drinking water in third world GIF Derived from BjΓΆrn Lomborg 2001 The Skeptical Environmentalist Cambridge University Press ISBN 0521010683 http //web archive org/web/20090225074856/http //www lomborg com/dyn/files/basic_items/69-file/skeptenvironChap1 pdf p 22 archived from http //www lomborg com/dyn/files/basic_items/69-file/skeptenvironChap1 pdf The line has been simplified; please see the original <blockquote>Percentage of people in the Third World with access to drinking water 1970 2000 The line here is a logistic best fit line a reasonable attempt to map out the best guess of development among very different definitions Source World Bank 1994 26 1975 90 WHO 1986 15 18 1970 83 Gleick 1998 262 264 1980 90 1990 4 Annan 2000 5 1990 2000 </blockquote> 2010-02-27 Jynto File Access to drinking water in third world GIF File Access to drinking water in third world small GIF Water supply Drinking water | ||||