MAKE A MEME
View Large Image

| View Original: | Appalachian-tennessee-arc-2003-status.jpg (344x160) | |||
| Download: | Original | Medium | Small | Thumb |
| Courtesy of: | commons.wikimedia.org | More Like This | ||
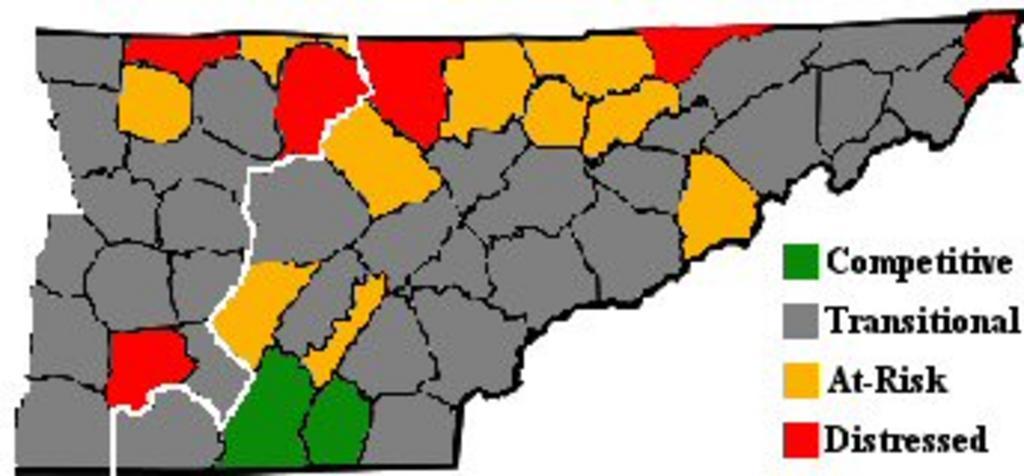
| Keywords: Appalachian-tennessee-arc-2003-status.jpg Map of Appalachian Tennessee which includes all counties in East Tennessee and the easternmost counties in Middle Tennessee showing each county's Appalachian Regional Commission-designated economic status using 2001-2003 data The status indicates how the county compares to the national average on unemployment income per capita and poverty rate Counties on par or ahead of the nation on these three indicators are designated Attainment no county in Tennessee received this designation Counties with unemployment and poverty rate equal or lower than the national average and an income per capita at least 80 of the national average are designated Competitive Hamilton and Bradley counties received this designation Counties lagging on just one of the three indicators are designated Transitional Counties lagging on two of the three indicators are considered At-Risk Counties lagging significantly on at least two indicators are considered Distressed The white boundary shows the border between East and Middle Tennessee Map_of_Tennessee_highlighting_Hancock_County svg 2009-08-24 13 42 UTC David Benbennick derivative work Bms4880 <span class signature-talk >talk</span> Map_of_Tennessee_highlighting_Hancock_County svg </nowiki> Uploaded with derivativeFX Economy of Tennessee Maps of Tennessee Tennessee in the 2000s | ||||