MAKE A MEME
View Large Image
| View Original: | Carbon cycle-cute diagram zh-hant.svg (540x417) | |||
| Download: | Original | Medium | Small | Thumb |
| Courtesy of: | commons.wikimedia.org | More Like This | ||
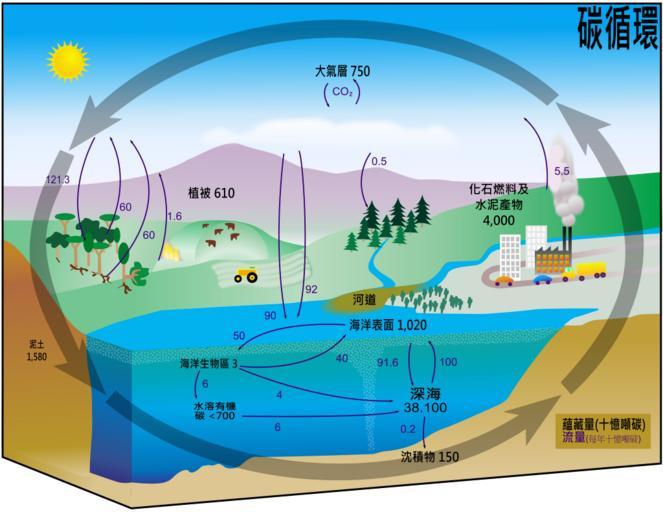
| Keywords: Carbon cycle-cute diagram zh-hant.svg en This carbon cycle diagram shows the storage and annual exchange of carbon between the atmosphere hydrosphere and geosphere in gigatons - or billions of tons - of Carbon GtC Burning fossil fuels by people adds about 5 5 GtC of carbon per year into the atmosphere zh-tw ńó│ÕŠ¬ńÆ░Õ ¢’╝īÕ▒Ģńż║ńó│ĶśŖĶŚÅķćÅÕÅŖµ»ÅÕ╣┤ńó│Õ ©Õż¦µ░ŻÕ▒żŃ üµ░┤ńĢīÕÅŖķÖĖńĢīõ╣ŗķ¢ōńÜ䵥üÕŗĢ’╝īõ╗źÕŹüÕääÕÖĖńó│Ķ©łń«ŚŃ éńćāńćÆÕī¢ń¤│ńćāµ¢Ö’╝īµ»ÅÕ╣┤Õ░▒ńé║Õż¦µ░ŻÕ▒żÕó×ÕŖĀÕż¦ń┤äõ║öÕŹüõ║öÕääÕÖĖńó│Ń é File Carbon cycle-cute diagram svg J Wong 2009-02-19 File Carbon_cycle-cute_diagram svg’╝łĶŗ▒µ¢ć’╝ēŃ ü File Carbon cycle-cute diagram-zh-Hans jpeg’╝łń« õĮōÕŁŚ’╝ē created with Inkscape Carbon cycle 3D diagrams SVG ecology | ||||