MAKE A MEME
View Large Image

| View Original: | CCL3L1-CCR5 Genotype Improves the Assessment of AIDS Risk in HIV-1-Infected Individuals -Figure 2.png (574x600) | |||
| Download: | Original | Medium | Small | Thumb |
| Courtesy of: | commons.wikimedia.org | More Like This | ||
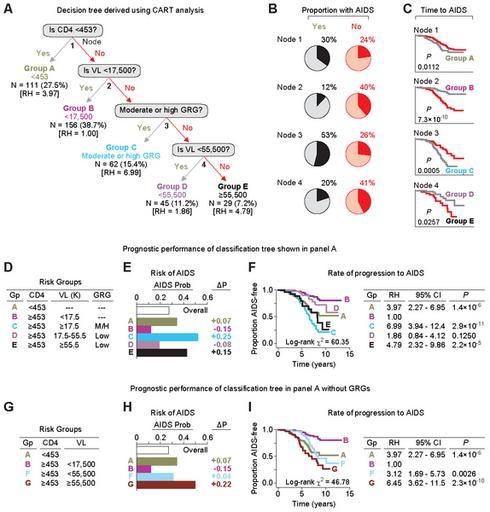
| Keywords: CCL3L1-CCR5 Genotype Improves the Assessment of AIDS Risk in HIV-1-Infected Individuals -Figure 2.png A A binary decision tree derived by CART analysis for the risk of developing AIDS 1987 criteria based on baseline CD4+ T cell counts viral load VL and GRG status in the seroconverting component of the WHMC HIV+ cohort The analysis identified five exclusive groups designated as Groups A to E The tree shows that the proximal split was based on the CD4 cell count and the CART analysis generated the cut-off to be 453 cells/mm3 The next split was based on a viral load of 17 500 copies/ml The third split was based on GRG status followed by another split at a viral load of 55 500 copies/ml The five groups generated are color-coded and the number of subjects in each of these groups is shown along with their proportion in the study group The values in brackets indicate the relative hazard estimates corresponding to each of these groups as shown in Figure 2F B Pie charts depicting the proportion of subjects in each of the splits who did or did not develop AIDS 1987 criteria Within each pie-chart the dark pie-slice represents the proportion of subjects who developed AIDS Yes and no refers to whether a subject does or does not categorize respectively to the indicated node C KM plots for the rate of progression to AIDS from time of seroconversion based on the split at each corresponding node in the decision tree shown in panel A The significance values shown below each KM plot were estimated using the logrank test D “F Association between the five risk groups panel D generated by CART and the risk panel E and rate of developing AIDS panel F Panel D defines the risk groups based on the baseline CD4 cells/mm3 steady state viral load k ×1 000 copies/ml and GRG status M/H moderate or high GRG; Low low GRG Gp group Panel E shows the probability Prob of developing AIDS within each risk group generated by CART analysis Overall refers to the probability of developing AIDS in the seroconverting component of the cohort without accounting for the laboratory or genetic markers ΔP change in probability from the overall probability Panel F shows the KM plots for rate of progression to AIDS for the five groups of subjects identified by CART The table to the right shows the relative hazards RH corresponding to these five groups estimated by using Cox proportional hazards models In these analyses the reference category RH 1 is group B which denotes subjects that have a CD4 of ‰¥453 cells/mm3 and a viral load of <17 500 copies/ml The results show that relative to this reference category groups A C and E are associated with a significantly increased risk of progressing rapidly to AIDS G “I Similar analyses to those shown in panels D to F but using risk groups in which the GRGs are not included as prognosticators In these analyses the risk groups A and B shown in panel A and panel D were used along with two new groups designated as group F and group G The latter two groups were derived from the Groups C to E shown in panel D by not accounting for the GRG status and dichotomizing the cohort further based on a viral load cut-off of 55 500 copies/ml Reference category RH 1 is group B In panels E and H prob refers to probability Uploaded for use in s CCL3L1-CCR5 Genotype Improves the Assessment of AIDS Risk in HIV-1-Infected Individuals http //www plosone org/article/info 3Adoi 2F10 1371 2Fjournal pone 0003165 Sept 08 Hemant Kulkarni Brian K Agan Vincent C Marconi Robert J O'Connell Jose F Camargo Weijing He Judith Delmar Kenneth R Phelps George Crawford Robert A Clark Matthew J Dolan Sunil K Ahuja This is an open-access article distributed under the terms of the Creative Commons Public Domain declaration which stipulates that once placed in the public domain this work may be freely reproduced distributed transmitted modified built upon or otherwise used by anyone for any lawful purpose cc-pd AIDS Genotypes | ||||