MAKE A MEME
View Large Image

| View Original: | Circle cos sin.gif (650x390) | |||
| Download: | Original | Medium | Small | Thumb |
| Courtesy of: | commons.wikimedia.org | More Like This | ||
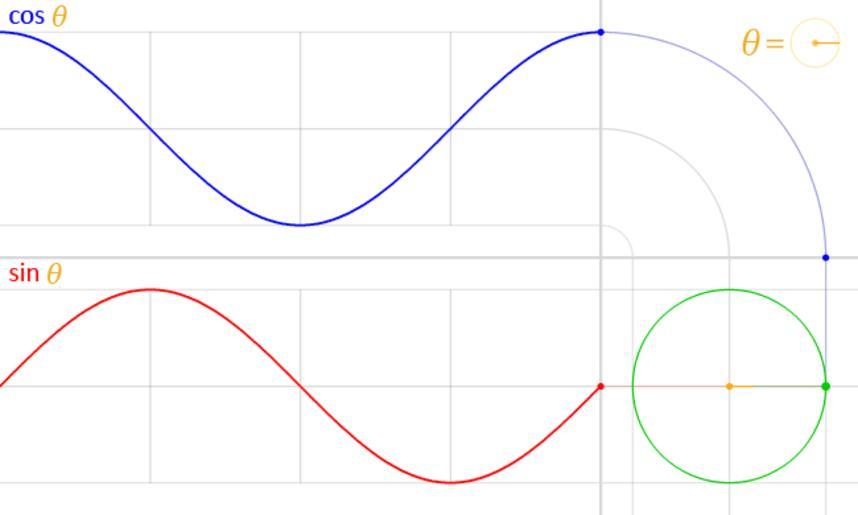
| Keywords: Circle cos sin.gif en We have the unit circle with radius 1 in green placed at the origin at the bottom right In the middle of this circle in yellow is represented the angle theta θ This angle is the amount of counter-clockwise rotation around the circle starting from the right on the x-axis as illustrated An exact copy of this little angle is shown at the top right as a visual illustration of the definition of θ At this angle and starting at the origin a faint green line is traced outwards radially This line intersects the unit circle at a single point which is the green point spinning around at a constant rate as the angle θ changes also at a constant rate The vertical position of this point is projected straight along the faint red line onto the graph on the left of the circle This results in the red point The y-coordinate of this red point the same as the y-coordinate of the green point is the value of the sine function evaluated at the angle θ that is y coordinate of green point sin θ As the angle θ changes the red point moves up and down tracing the red graph This is the graph for the sine function The faint vertical lines seen passing to the left are marking every quadrant along the circle that is at every angle of 90° or Ď /2 radians Notice how the sine curve goes from 1 to zero to -1 then back to zero at exactly these lines This is reflecting the fact sin 0 0 sin Ď /2 1 sin Ď 0 and sin 3Ď / 2 -1 A similar process is done with the x-coordinate of the green point However since the x-coordinate is tilted from the usual convention to plot graphs where y f x with y vertical and x horizontal an untilt operation was performed in order to repeat the process again in the same orientation instead of vertically This was represented by a bend seen on the top right Again the green point is projected upwards along the faint blue line and this bent projection ends up in the top graph ™s rightmost edge at the blue point The y-coordinate of this blue point which due to the bend in the projection is the same as the x-coordinate of the green point is the value of the cosine function evaluated at the angle θ that is x coordinate of green point cos θ The blue curve traced by this point as it moves up and down with changing θ is the the graph of the cosine function Notice again how it behaves at it crosses every quadrant reflecting the fact cos 0 1 cos Ď /2 0 cos Ď -1 and cos 3Ď /2 0 own LucasVB 2014-03-16 Trigonometry Trigonometric functions Sine function Cosine function Mathematical animations | ||||