MAKE A MEME
View Large Image

| View Original: | Convolution Animation (Gaussian).gif (360x222) | |||
| Download: | Original | Medium | Small | Thumb |
| Courtesy of: | commons.wikimedia.org | More Like This | ||
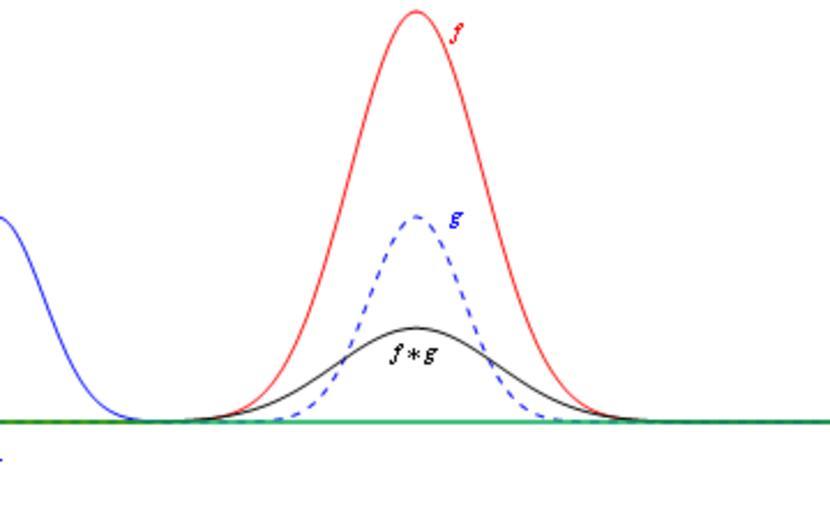
| Keywords: Convolution Animation (Gaussian).gif en A diagram showing the convolution of two Gaussian functions <math>f t e -5t 2 </math> red and <math>g t \frac 1 2 e -10 t 2 </math> dashed blue Also sohwn is the time-reversed and shifted g ˆ’t in blue the product f t g ˆ’t green and the convolution h t f t ˆ—g t black equal to the area of the product at the particular own Inductiveload 2009-03-05 Mathematica Code <pre><nowiki> Function definitions ft_ Exp-5 t 2; gt_ Exp-10 t 2/2; hy_ Module t Convolveft gt t y ; Parts of the drawing that only need to be computed once constplots Plot ft gt ht t -2 2 PlotStyle -> Red Blue Dashed Black ClippingStyle -> False Axes -> False Exclusions -> False ; anim TableShow The plots we generated earlier constplots Plot the time reversed gt g\Tau-t Plotg\Tau - t t -5 5 PlotPoints -> 100 ClippingStyle -> False PlotStyle -> Blue Axes -> False Plot the product of the ft and g\Tau-t Plotft g\Tau - t t -5 5 PlotPoints -> 100 ClippingStyle -> False Filling -> Axis FillingStyle -> DirectiveGreen Opacity0 2 PlotStyle -> Green Axes -> False Plot the embellishments Graphics Blue Line \Tau -0 05 \Tau 1 1 Red Textf 2 95 Background -> None Blue Textg 2 5 Background -> None Blue Text g \Tau-t \Tau - 0 35 4 Background -> None Green Text f t g \Tau-t \Tau - 0 35 -0 04 Background -> None Black TextStarf g 0 17 Background -> None Blue Text \Tau \Tau -0 1 Background -> White PlotRange -> -1 9 1 9 - 2 1 \Tau -2 2 025 Table index is the time delay ; ListAnimateanim Export anim gif anim </nowiki></pre> Convolution | ||||