MAKE A MEME
View Large Image

| View Original: | CPM_Network_Diagram.jpg (739x638) | |||
| Download: | Original | Medium | Small | Thumb |
| Courtesy of: | commons.wikimedia.org | More Like This | ||
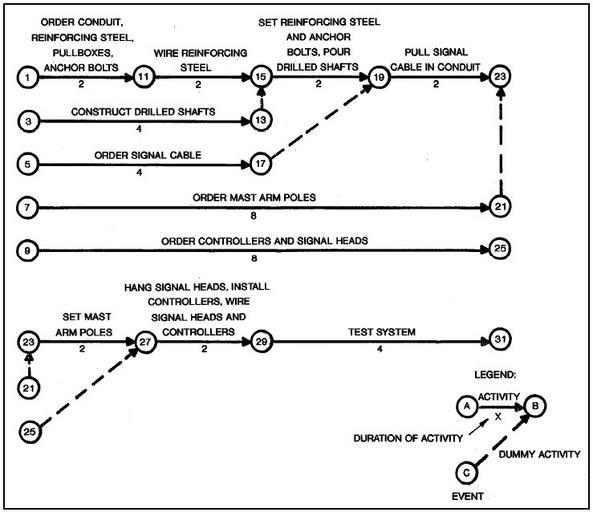
| Keywords: CPM Network Diagram.jpg en Example of CPM Network Diagram The critical path method CPM has proved a successful method for planning organizing and controlling projects Initially this management tool outlines the project graphically in the form of a network diagram This representation shown in Figure 12-3 illustrates The required operational sequence Which operations are concurrent and Which must be completed before others can be initiated CPM operations are referred to as activities In Figure 12-3 an example of the application of CPM to the installation of a traffic control system the activities necessary to complete the project are denoted by a line with an arrowhead The circled numbers represent events which mark the beginning or completion of an activity Dashed lines represent dummy activities which do not require any time but must be completed before another event can occur The number below the activity represents the amount of time required to complete the activity The critical path represents the project duration In the example the critical path is represented by the activities associated with events 1-11-15-19-23-27-29-31 In the example if activity 7-21 required a time of 10 instead of 8 then the critical path would become 7-21-23-27-29-31 because this sequence of activities would require a longer time In this case the receipt of mast arm poles would establish the critical path because they must be received before they can be set in place http //ops fhwa dot gov/publications/fhwahop06006/chapter_12 htm in Traffic Control Systems Handbook Chapter 12 Design and Implementation United States Department of Transportation - Federal Highway Administration Last modified January 23 2009 PD-USGov CPM diagrams | ||||