MAKE A MEME
View Large Image

| View Original: | Decay heat illustration.PNG (784x583) | |||
| Download: | Original | Medium | Small | Thumb |
| Courtesy of: | commons.wikimedia.org | More Like This | ||
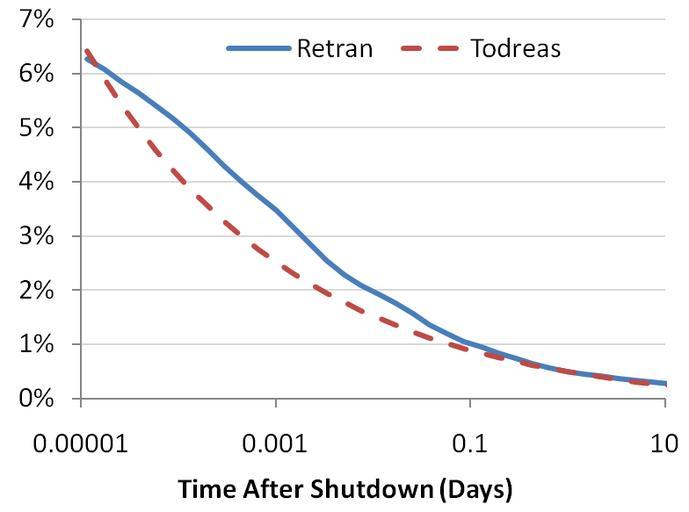
| Keywords: Decay heat illustration.PNG en Graph of Decay heat as fraction of full power from a SCRAMed operating power reactor Two models are displayed in the graph one being Retran which uses a 11 group exponential decay the other being Todreas and Kazimi from published work in 1990 which was adapted from previous empirical correlations The Retran model inputs no assumptions of operating history and the Todreas model requires the operating time before shutdown which was assumed to be 2 years for this application own Theanphibian 2011-03-13 <gallery>Image Decay heat illustration2 PNG Horizontal axis relabeled</gallery> Reference information Todreas and Kazimi Nuclear Systems Volume I Thermal Hydraulic Fundamentals http //www nuceng ca/papers/decayhe1b pdf <math>\frac P P_0 0 066 \left \left T-T_s -0 2 \right -T -0 2 \right</math> Retran 11 group model http //www exitech com/models/core_neutronics htm <math>\frac P P_0 \sum_ i 1 11 P_i e -\lambda t </math> Cc-zero Nuclear power schemas and diagrams | ||||