MAKE A MEME
View Large Image

| View Original: | Demography of Florida Prisons.svg (800x600) | |||
| Download: | Original | Medium | Small | Thumb |
| Courtesy of: | commons.wikimedia.org | More Like This | ||
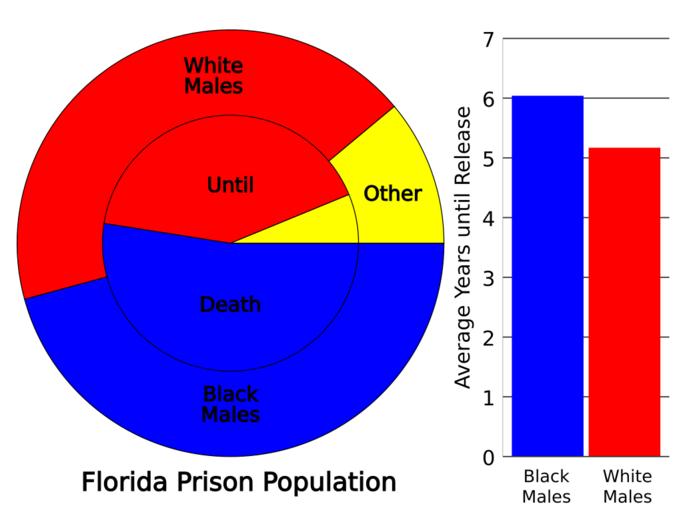
| Keywords: Demography of Florida Prisons.svg translate yes en Black and white males make up the majority of the prison population but white males are 4 less likely to be serving a life or effectively life sentence death sentence or release after age 100 and black males are 15 more likely to be serving a life or effectively life sentence Women are 60 less likely to be serving a life or effectively life sentence Of those who will be released before they reach age 100 the remaining time for black males is 17 longer than for white males The percentage of white males scheduled to be released when they are from 75 to 99 years old is 27 greater and for black males 19 less likely Data from the Florida Department of Corrections as of February 2015 http //www dc state fl us/ 2015-02-27 own Delphi234 other versions Data wikitable sortable Demographic Population Percent Release<br>in years 75-99 at release Death in prison - Black male 46 521 45 78 6 04 859 36 87 7 198 52 49 - White male 43 852 43 15 5 17 1 278 54 85 5 665 41 31 - White female 4 843 4 77 2 98 74 3 18 194 1 41 - Hispanic male 3 659 3 60 5 83 81 3 48 436 3 18 - Black female 2 129 2 09 1 73 24 1 03 114 0 83 - All others male 320 0 31 7 19 64 0 47 - Hispanic female 189 0 19 4 19 3 0 13 14 0 10 - American Indian male 79 0 08 5 18 8 0 34 23 0 17 - All others female 12 0 01 4 08 2 0 01 - Asian male 12 0 01 11 30 3 0 13 3 0 02 - American Indian female 9 0 01 1 20 1 0 01 - Asian female 2 0 00 5 33 - class sortbottom Total 101 627 2 330 13 714 cc-zero Uploaded with UploadWizard Correctional population statistics for the United States Demographics of Florida | ||||