MAKE A MEME
View Large Image

| View Original: | Dirichlet process draws.svg (720x720) | |||
| Download: | Original | Medium | Small | Thumb |
| Courtesy of: | commons.wikimedia.org | More Like This | ||
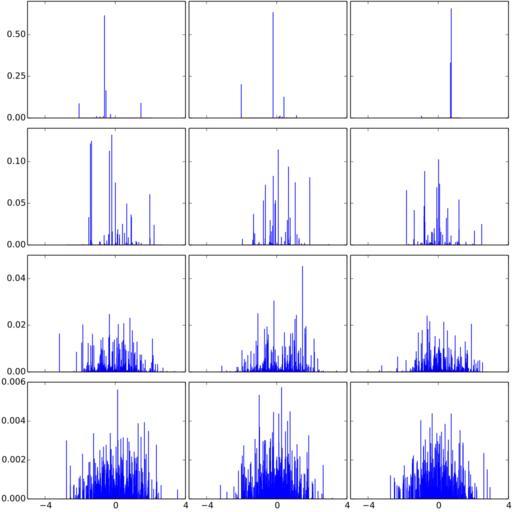
| Keywords: Dirichlet process draws.svg en Draws from the Dirichlet process DP N 0 1 alpha Each row uses a different alpha 1 10 100 and 1000 A row contains 3 repetitions of the same experiment Python source code <pre><nowiki> import matplotlib pyplot as plt import numpy as np from scipy stats import beta from scipy stats import norm def draw_stick_breaking ax alpha base_distribution beta_prime_ks theta_ks beta_distribution beta 1 alpha rest 1 for k in range 500 theta_k base_distribution rvs beta_k beta_distribution rvs theta_ks append theta_k beta_prime_k beta_k rest beta_prime_ks append beta_prime_k rest 1-beta_k if rest < 1e-4 break ax stem theta_ks beta_prime_ks markerfmt ' ' def main np random seed 1 reproducibility alphas 1 10 100 1000 base_distribution norm 0 1 n_rows len alphas n_cols 3 fig axarr plt subplots n_rows n_cols sharex True sharey row figsize 10 10 for i_row in range n_rows for i_col in range n_cols draw_stick_breaking axarri_rowi_col alphasi_row base_distribution set 3 ticks on each axis axarr00 xaxis set_major_locator plt MaxNLocator 3 for i_row in range n_rows axarri_row0 yaxis set_major_locator plt MaxNLocator 3 fig tight_layout pad 0 15 fig savefig 'dirichlet svg' plt show if __name__ '__main__' main </nowiki></pre> Images with Python source code 2014-10-20 18 04 02 own Qorilla other versions cc-zero Uploaded with UploadWizard Images with Python source code Stochastic processes Dirichlet process | ||||