MAKE A MEME
View Large Image

| View Original: | Economics Gini coefficient svg.png (500x500) | |||
| Download: | Original | Medium | Small | Thumb |
| Courtesy of: | commons.wikimedia.org | More Like This | ||
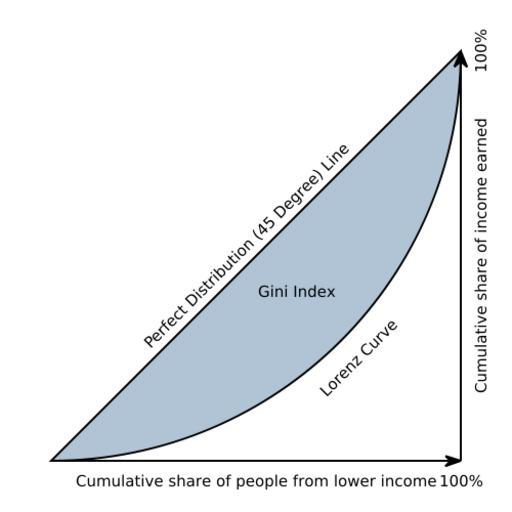
| Keywords: Economics Gini coefficient svg.png version by Bluemoose You can think of the horizontal axis as percent of people and the vertical axis as the percent of income those people receive Therefore the curves always start and end at the same places where 0 of people make 0 of the country's income and 100 of people making 100 of the total income The disparity comes in at the left hand side of the curve where the percent of people is higher than the percent of income they receive i e 10 of the people getting 5 of the total income And at the right hand side when the percent of income received rises more than the percent of people receiving it page is/was here Original uploader was BenFrantzDale at http //en wikipedia org en wikipedia Bluemoose Lorenz curves depicting Gini coefficient Economics Gini coefficient 2.png version by Bluemoose You can think of the horizontal axis as percent of people and the vertical axis as the percent of income those people receive Therefore the curves always start and end at the same places where 0 of people make 0 of the country's income and 100 of people making 100 of the total income The disparity comes in at the left hand side of the curve where the percent of people is higher than the percent of income they receive i e 10 of the people getting 5 of the total income And at the right hand side when the percent of income received rises more than the percent of people receiving it page is/was here Original uploader was BenFrantzDale at http //en wikipedia org en wikipedia Bluemoose Lorenz curves depicting Gini coefficient | ||||