MAKE A MEME
View Large Image

| View Original: | Exponential Function (Imag Part) Density.png (850x700) | |||
| Download: | Original | Medium | Small | Thumb |
| Courtesy of: | commons.wikimedia.org | More Like This | ||
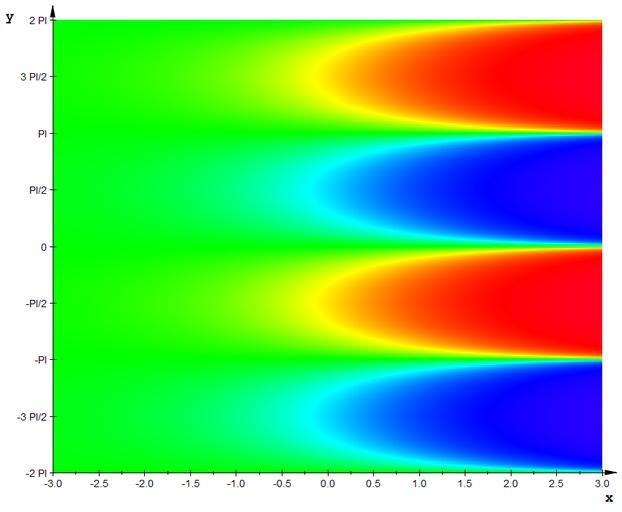
| Keywords: Exponential Function (Imag Part) Density.png Diagram of the real part of exponetial function in the complex plane The density is given by <math>z \operatorname Re \left \exp \left x + i y \right \right </math> Blue represents high values red represents low values Please note that the colouring is non-linear it is based on the ArcTan function see the code below and therefore a similar change in hue does NOT necessarily denote a similar change in value Own drawing Plotted in MuPAD 2007-04-20 Inductiveload MuPAD Code <pre> f Im exp x+I y ylimit 2 PI xlimit 3 hsv x y z -> RGB fromHSV 121+85 arctan z 1 1 cplot plot Density f x -xlimit xlimit y -ylimit ylimit Mesh 800 800 AxesTitleFont Courier New Bold 14 TicksLabelFont Arial 10 FillColorFunction hsv YTicksNumber None YTicksAt -3 PI/2 -3 PI/2 -PI -PI -PI/2 -PI/2 -2 PI -2 PI 0 0 PI/2 PI/2 PI PI 3 PI/2 3 PI/2 2 PI 2 PI XTicksDistance 0 5 plot cplot Axes Frame Width 8 5 unit inch Height 7 unit inch </pre> Complex exponential function Hue | ||||