MAKE A MEME
View Large Image

| View Original: | Fermi National Accelerator Laboratory - Holographic Noise Chart.png (804x612) | |||
| Download: | Original | Medium | Small | Thumb |
| Courtesy of: | commons.wikimedia.org | More Like This | ||
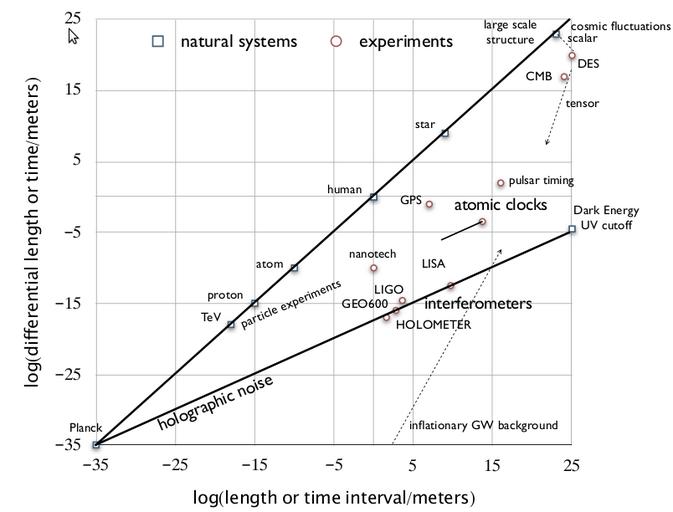
| Keywords: Fermi National Accelerator Laboratory - Holographic Noise Chart.png graph en This plot shows the sensitivity of various experiments to fluctuations in space and time Horizontal axis is the log of apparatus size or duration time the speed of light in meters; vertical axis is the log of the rms fluctuation amplitude in the same units The lower left corner represents the Planck length or time In these units the size of the observable universe is about 26 Various physical systems and experiments are plotted The holographic noise line represents the rms transverse holographic fluctuation amplitude on a given scale The most sensitive experiments are Michelson interferometers http //holometer fnal gov/ Fermi National Accelerator Laboratory Craig Hogan 2010-10-04 PD-USGov Noise physics Astrophysics Unidentified graphs | ||||