MAKE A MEME
View Large Image

| View Original: | Figures1.gif (560x434) | |||
| Download: | Original | Medium | Small | Thumb |
| Courtesy of: | commons.wikimedia.org | More Like This | ||
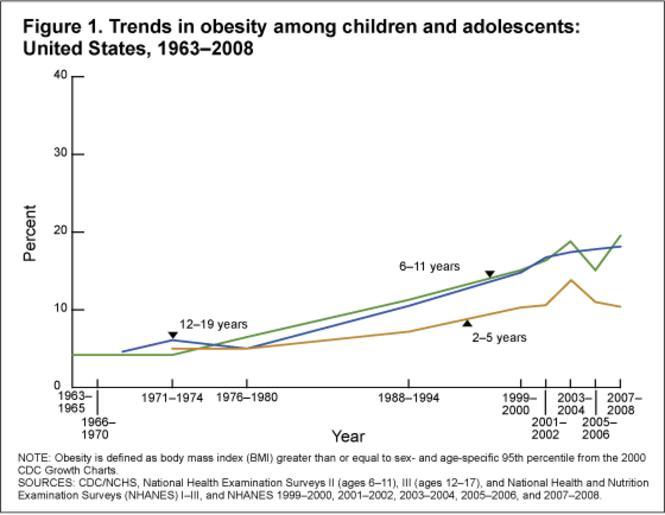
| Keywords: Figures1.gif en This is a diagram depicting the rise of overweight among ages 2-19 in the US http //www cdc gov/nchs/data/hestat/obesity_child_07_08/Figures1 gif Cynthia Ogden Ph D and Margaret Carroll M S P H 2010-06 http //commons wikimedia org/wiki/File PrevalenceOverweightAge6-19 GIF PD-USGov Sociological bar charts Obesity | ||||