MAKE A MEME
View Large Image

| View Original: | Greenhouse Gas Emissions from Electricity Production IEA.PNG (862x528) | |||
| Download: | Original | Medium | Small | Thumb |
| Courtesy of: | commons.wikimedia.org | More Like This | ||
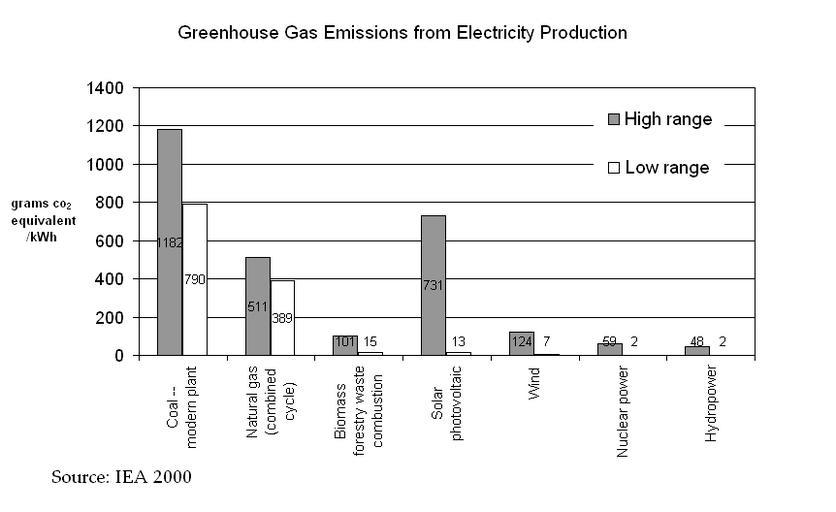
| Keywords: Greenhouse Gas Emissions from Electricity Production IEA.PNG International Energy Agency IEA -Implementing Agreement for Hydropower Technologies and Programmes; Ottawa Canada 2000 See below http //www publications parliament uk/pa/cm200506/cmselect/cmenvaud/584/5111706 htm Frans H Koch 2000 The table below was published in Hydropower-Internalised Costs and Externalised Benefits ; Frans H Koch; International Energy Agency IEA -Implementing Agreement for Hydropower Technologies and Programmes; Ottawa Canada 2000 Emissions Produced by 1 kWh of Electricity Based on Life-Cycle Analysis - Generation option Greenhouse gas emissions gram equiv CO2/kWh SO2 emissions milligram/kWh NOx emissions milligram/kWh NMVOC milligram/kWh Particulate matter milligram/kWh - Hydropower 2-48 5-60 3-42 0 5 - Coal ”modern plant 790-1182 700-32321+ 700-5273+ 18-29 30-663+ - Nuclear 2-59 3-50 2-100 0 2 - Natural gas combined cycle 389-511 4-15000+1 13+-1500 72-164 1-10+ - Biomass forestry waste combustion 15-101 12-140 701-1950 0 217-320 - Wind 7-124 21-87 14-50 0 5-35 - Solar photovoltaic 13-731 24-490 16-340 70 12-190 1 The sulphur content of natural gas when it comes out of the ground can have a wide range of values when the hydrogen sulphide content is more that 1 the gas is usually known as sour gas Normally almost all of the sulphur is removed from the gas and sequestered as solid sulphur before the gas is used to generate electricity Only in the exceptional case when the hydrogen sulphide is burned would the high values of SO2 emissions occur Check categories 2010 July 1 en wikipedia Comparisons_of_life-cycle_greenhouse_gas_emissions 1 Greenhouse gases | ||||