MAKE A MEME
View Large Image

| View Original: | Hyper-Cam_smokestack.png (539x532) | |||
| Download: | Original | Medium | Small | Thumb |
| Courtesy of: | commons.wikimedia.org | More Like This | ||
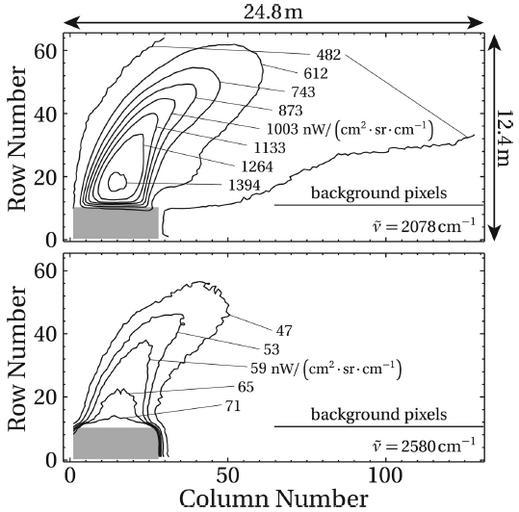
| Keywords: Hyper-Cam smokestack.png en Top panel Contour map of the time-averaged spectral radiance at 2078 cm-1 corresponding to a CO2 emission line Bottom panel Contour map of the spectral radiance at 2580 cm-1 corresponding to continuum emission from particulates in the plume The translucent gray rectangle indicates the position of the stack The horizontal line at row 12 between columns 64-128 indicate the pixels used to estimate the background spectrum 2011-12-14 Environmental Sci Tech 44 9390-9397 Oct 2010 Kevin C Gross Kenneth C Bradley and Glen P Perram PD-USGov Materials science Uploaded with UploadWizard Meteorological theory Measuring instruments clouds | ||||