MAKE A MEME
View Large Image

| View Original: | Kaiser-Window-Spectra.jpg (622x451) | |||
| Download: | Original | Medium | Small | Thumb |
| Courtesy of: | commons.wikimedia.org | More Like This | ||
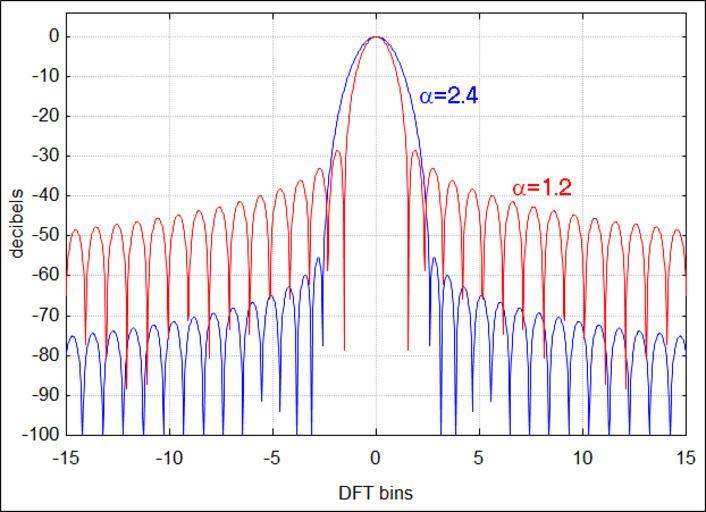
| Keywords: Kaiser-Window-Spectra.jpg en Spectra of two Kaiser windows 2013-02-25 own Bob K The JPG image generated by the enclosed Octave script replaces the previous versions which were derived from Kaiser-Window-Spectra svg by RetoGalli Octave script <source lang Matlab > graphics_toolkit gnuplot N 2 17; n 0 N-1; P 15; Maximum bin index drawn dr 100; dynamic range of plot M 32; Fourier transform size as multiple of window length k 1 M N-1-M N/2 /M; k2 -P 1/M P; figure hold on set gca 'FontSize' 10 alpha 2 4; w besseli 0 pi alpha sqrt 1- 2 n/ N-1 -1 2 /besseli 0 pi alpha ; H abs fft w zeros 1 M-1 N ; H fftshift H ; H H/max H ; H 20 log10 H ; H max -dr H ; H2 interp1 k H k2 ; plot k2 H2 'color' 'blue' xlim -P P ylim -dr 6 set gca 'YTick' 0 -10 -dr grid 'on' ylabel 'decibels' xlabel 'DFT bins' text 2 1 -15 '\alpha 2 4' 'color' 'blue' 'fontsize' 12 alpha 1 2; w besseli 0 pi alpha sqrt 1- 2 n/ N-1 -1 2 /besseli 0 pi alpha ; H abs fft w zeros 1 M-1 N ; H fftshift H ; H H/max H ; H 20 log10 H ; H max -dr H ; H2 interp1 k H k2 ; plot k2 H2 'color' 'red' text 6 6 -38 '\alpha 1 2' 'color' 'red' 'fontsize' 12 hold off </source> Signal processing Window function | ||||