MAKE A MEME
View Large Image

| View Original: | KaiserWindow.jpg (497x430) | |||
| Download: | Original | Medium | Small | Thumb |
| Courtesy of: | commons.wikimedia.org | More Like This | ||
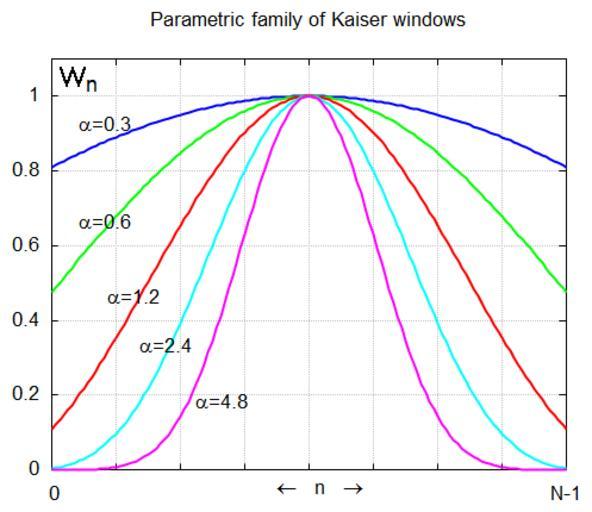
| Keywords: KaiserWindow.jpg en Kaiser Window Function for different alpha values 2013-02-25 10 16 32 own Bob K The JPG image generated by the enclosed Octave source code replaces the 4/28/2009 version which is a derivative of KaiserWindow svg by RetoGalli Octave script <source lang Matlab > graphics_toolkit gnuplot N 129; M N-1; n 0 M; figure hold on title 'Parametric family of Kaiser windows' alpha 0 3; w besseli 0 pi alpha sqrt 1- 2 n/M -1 2 /besseli 0 pi alpha ; plot 0 N-1 w 'color' 'blue' 'linewidth' 2 text 7 92 '\alpha 0 3' ylabel ' ' create left margin text 2 1 05 'W_n' 'fontsize' 14 text 56 -0 05 '\leftarrow n \rightarrow' xlim 0 M ylim 0 1 1 grid on set gca 'XTick' 0 1/8 1 M set gca 'XTickLabel' ' 0'; ' '; ' '; ' '; ' '; ' '; ' '; ' '; 'N-1 ' alpha 0 6; w besseli 0 pi alpha sqrt 1- 2 n/M -1 2 /besseli 0 pi alpha ; plot 0 N-1 w 'color' 'green' 'linewidth' 2 text 7 66 '\alpha 0 6' alpha 1 2; w besseli 0 pi alpha sqrt 1- 2 n/M -1 2 /besseli 0 pi alpha ; plot 0 N-1 w 'color' 'red' 'linewidth' 2 text 14 46 '\alpha 1 2' alpha 2 4; w besseli 0 pi alpha sqrt 1- 2 n/M -1 2 /besseli 0 pi alpha ; plot 0 N-1 w 'color' 'cyan' 'linewidth' 2 text 22 33 '\alpha 2 4' alpha 4 8; w besseli 0 pi alpha sqrt 1- 2 n/M -1 2 /besseli 0 pi alpha ; plot 0 N-1 w 'color' 'magenta' 'linewidth' 2 text 36 18 '\alpha 4 8' hold off </source> </nowiki> Uploaded with derivativeFX Signal processing Mathematical diagrams | ||||