MAKE A MEME
View Large Image

| View Original: | Lda-gauss-1.svg (719x434) | |||
| Download: | Original | Medium | Small | Thumb |
| Courtesy of: | commons.wikimedia.org | More Like This | ||
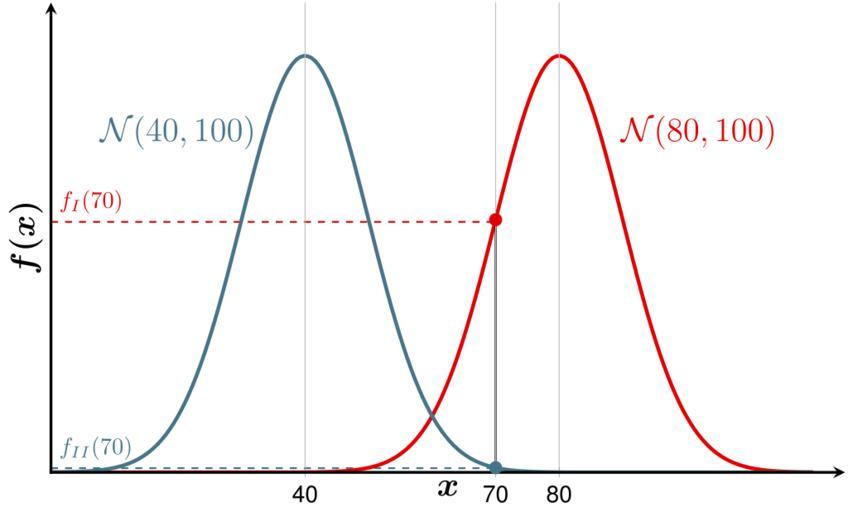
| Keywords: Lda-gauss-1.svg en Normal distribution for a discriminant analysis de Normalverteilung bei einer Diskriminanzalayse e30000 <math>\mathcal N 80 100 </math> 47758c <math>\mathcal N 40 100 </math> own MartinThoma 2014-08-11 cs 0 0 5 anchor south rotate 90 font \boldmath\Large \coordinate plotAcoord at axis cs 70 0 024 ; \coordinate plotAcoordY at axis cs 0 0 024 ; \drawplotA thick dashed plotAcoord - plotAcoordY -- plotAcoord ; \coordinate plotBcoord at axis cs 70 0 0004 ; \coordinate plotBcoordY at axis cs 0 0 0004 ; \drawplotB thick dashed plotBcoord - plotBcoordY -- plotBcoord ; \nodeabove right 0cm and 0cm of plotAcoordY color red 90 black f1y f_ I 70 ; \nodeabove right 0cm and 0cm of plotBcoordY color cyan 50 black f2y f_ II 70 ; Plots of the distributions \addplot domain 0 120 samples 200 plotA gauss 80 100 ; \addplot domain 0 120 samples 200 plotB gauss 40 100 ; Mark points \addplot+plotA samples at 70 mark mark options scale 1 fill red 90 black gauss 80 100 ; \addplot+plotB samples at 70 mark mark options scale 1 fill cyan 50 black gauss 40 100 ; \coordinate a at axis cs 70 0 024 ; \drawblack thick a - current plot begin -- a ; Add labels \nodeplotA above at axis cs 102 0 03 \Large \mathcal N 80 100 ; \nodeplotB above at axis cs 20 0 03 \Large \mathcal N 40 100 ; \addlegendentry \mu 80 \enskip \sigma 2 100 \addlegendentry \mu 40 \enskip \sigma 2 100 \end axis \end tikzpicture \end preview \end document </source> TikZ diagrams Images by Martin Thoma/Mathematics Discriminant analysis Cc-zero | ||||