MAKE A MEME
View Large Image

| View Original: | Lgm temperature curve 1.jpg (800x600) | |||
| Download: | Original | Medium | Small | Thumb |
| Courtesy of: | commons.wikimedia.org | More Like This | ||
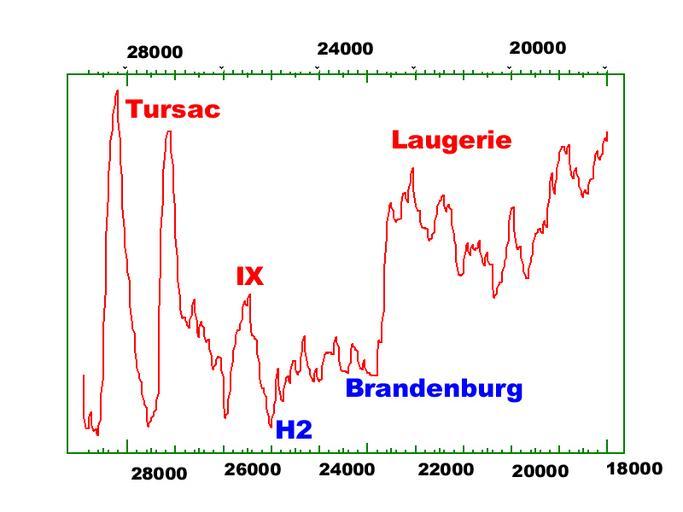
| Keywords: Lgm temperature curve 1.jpg Temperature curve of maximum of last glacial maximum LGM Y-axis is temperature related X axis time Up wermed down colder time is calendar years ago Based on NGRPIP oxygen isotope delta018 data Own 2007-12-21 Janne Naukkarinen Unidentified graphs | ||||