MAKE A MEME
View Large Image

| View Original: | NW cb16.png (480x480) | |||
| Download: | Original | Medium | Small | Thumb |
| Courtesy of: | commons.wikimedia.org | More Like This | ||
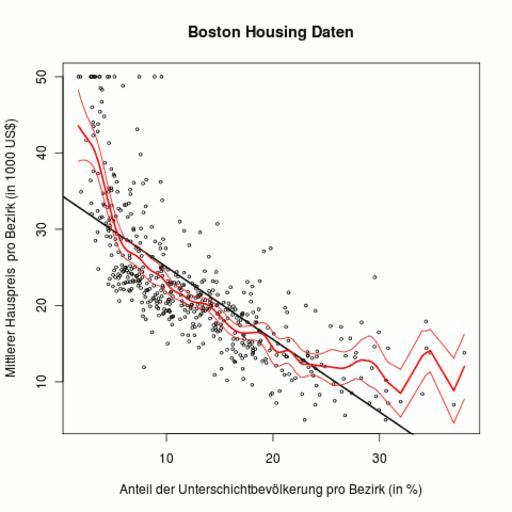
| Keywords: NW cb16.png en Nadaraya Watson estimator with optimal bandwidth and pointwise confidence band and linear regression estimator de Lineare Regression und Nadaraya Watson Schätzer mit optimaler Bandweite und punktweisen Konfidenzband own Sigbert 2010-08-07 The R program creates the PNG file library np library mlbench data BostonHousing s <- sort BostonHousing 13 index return T x <- BostonHousings ix 13 y <- BostonHousings ix 14 lr <- lm y~x nw <- npreg y~x yh <- fitted nw se <- se nw uc <- fitted nw +1 96 se lc <- fitted nw -1 96 se png NW_cb png plot x y xlab Anteil der Unterschichtbevölkerung pro Bezirk in ylab Mittlerer Hauspreis pro Bezirk in 1000 US main Boston Housing Daten cex 0 5 abline lr lwd 2 lines x fitted nw lwd 2 col red lines x uc lwd 1 col red lines x lc lwd 1 col red dev off Scatterplots Created with R | ||||