MAKE A MEME
View Large Image

| View Original: | PE1989e.png (977x497) | |||
| Download: | Original | Medium | Small | Thumb |
| Courtesy of: | commons.wikimedia.org | More Like This | ||
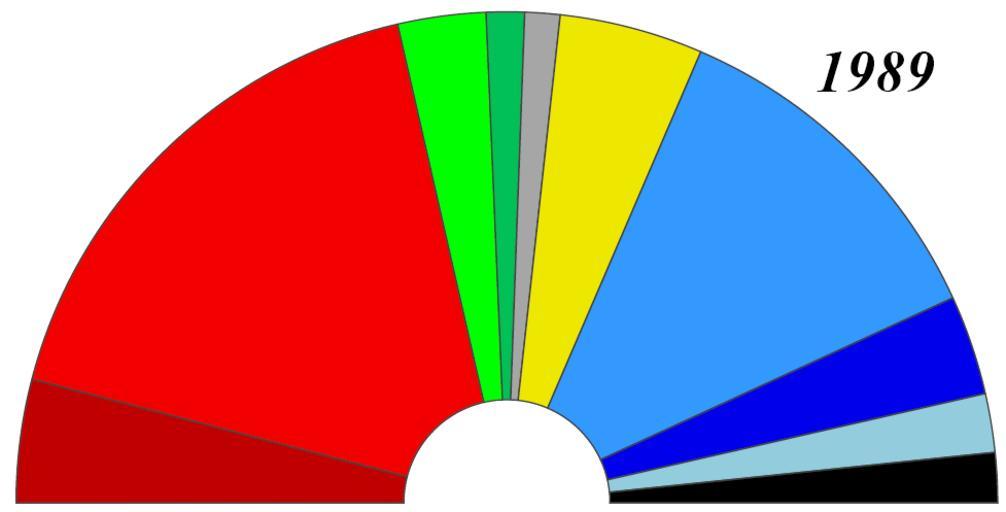
| Keywords: PE1989e.png Results of 1989 European Elections The groups at 25 July 1989 were SOC EPP 79-92 LDR EUL LU ED G EDA DR RBW 89-94 and NI Groups are colored to the following schema 3399FF Conservative/Christian Democrat CD EPP 79-92 EPP 92-99 FE EPP-ED 0000FF Conservatives only C ED MER FF0000 Social Democrats S SOC PES 990000 Communist/Far-Left COM LU EUL EUL/NGL FFFF00 Liberal/Centrist L LD LDR ERA ELDR ALDE 99ffff National Conservatives UDE EPD EDA UFE UEN 00FF00 Greens only G 009900 Green/Regionalist RBW 84-89 RBW 89-94 G/EFA 999999 Heterogeneous CDI TGI 999999 Independents NI ff9900 Eurosceptics EN I-EN EDD IND/DEM 000000 Far-Right Nationalist ER DR ITS For details on these groups see en Political groups of the European Parliament These charts are designed to be simple easy to edit and to be used anywhere There are no names so it can be used on other language wikis and there are no numbers as the exact figures vary depending on the reporting source but only by a few seats so the graph can represent any - so long as there are no numbers So if you want to make a flashier graph or add data to it please save under a new name Own 2007-12-20 JLogan 1979 1984 1994 1999 2004 PE1989e svg Election apportionment diagrams of the European Parliament | ||||