MAKE A MEME
View Large Image

| View Original: | Peak-power-average-power-tau-T.png (1034x839) | |||
| Download: | Original | Medium | Small | Thumb |
| Courtesy of: | commons.wikimedia.org | More Like This | ||
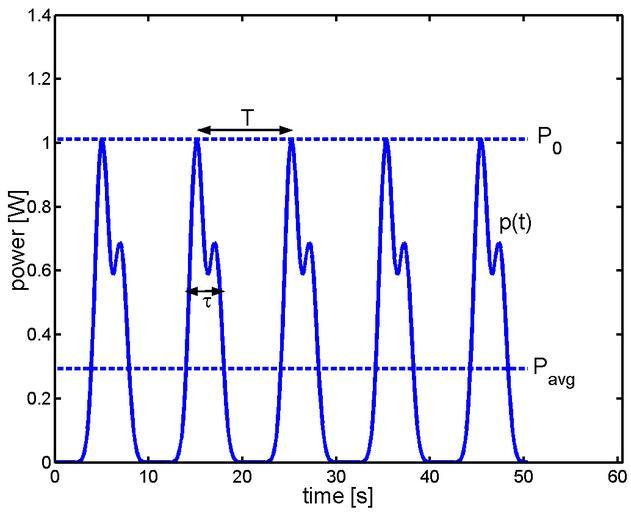
| Keywords: Peak-power-average-power-tau-T.png en wikipedia 2012 January 2 Plot of the instantaneous power p t of periodic signal of period T The peak power and average power are also shown <math>\tau</math> is the pulse width see Power_ physics for a definition I created this plot today in MATLAB -- Pgabolde 06 41 22 Nov 2004 UTC en wikipedia Premeditated Chaos CommonsHelper 2004-11-22 Pgabolde wikipedia en graph Created with MATLAB Pgabolde Original upload log page en wikipedia Peak-power-average-power-tau-T png 2007-10-23 03 52 Omegatron 1034×839× 9953 bytes <nowiki>cropped using an external editor</nowiki> 2004-11-22 06 34 Pgabolde 1200×900× 12360 bytes <nowiki>plot of instantaneous power and peak power</nowiki> Concepts Energy schemas and diagrams Audio electronics Sound technology | ||||