MAKE A MEME
View Large Image

| View Original: | Plottype.png (480x480) | |||
| Download: | Original | Medium | Small | Thumb |
| Courtesy of: | commons.wikimedia.org | More Like This | ||
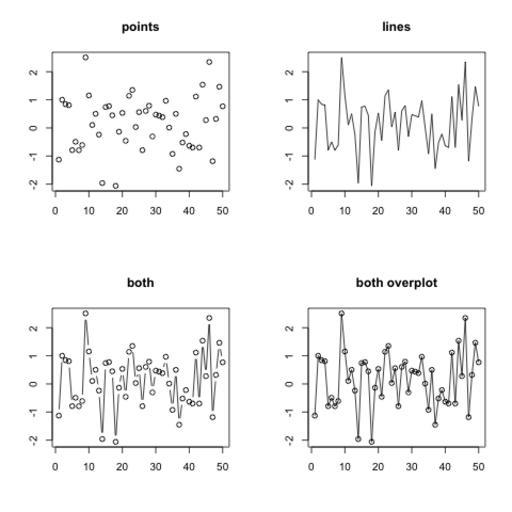
| Keywords: Plottype.png en Different type of plots in the R plot function own PAC2 2010-05-18 R source <pre width 80> x1 <- rnorm 50 png plottype png par mfrow c 2 2 plot x1 type p main points ylab xlab plot x1 type l main lines ylab xlab plot x1 type b main both ylab xlab plot x1 type o main both overplot ylab xlab dev off </pre> Created with R Uncategorized 2015 March 11 | ||||