MAKE A MEME
View Large Image

| View Original: | Population pyramid of Finland 2012.svg (360x432) | |||
| Download: | Original | Medium | Small | Thumb |
| Courtesy of: | commons.wikimedia.org | More Like This | ||
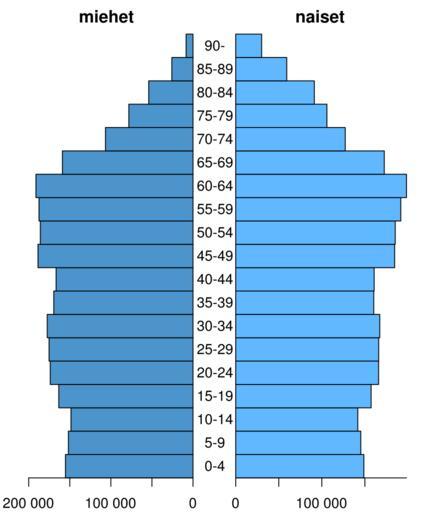
| Keywords: Population pyramid of Finland 2012.svg en Finnish population by age and gender end of 2012 Men left dark blue / Women right light blue fi Suomen väestö iän ja sukupuolen mukaan vuoden 2012 lopussa Miehet vasen tumman sininen / Naiset oikea vaalean sininen 2013-04-29 20 26 24 Data from http //www tilastokeskus fi/tup/suoluk/suoluk_vaesto_en html Statistics Finland Population by age group end of 2012 graph generated by R Qtea R source Modified from File Fin population by age 2005 png by User Jkv <pre> m <- c 155281 151706 148569 163421 173775 175226 177454 169502 166649 188707 185863 187478 191222 158967 106568 78139 53901 25782 8412 w <- c 148802 145274 141760 157292 165983 166069 167305 160340 160821 184591 185308 191717 198366 172561 127231 105940 91302 59277 30113 a <- c 0-4 5-9 10-14 15-19 20-24 25-29 30-34 35-39 40-44 45-49 50-54 55-59 60-64 65-69 70-74 75-79 80-84 85-89 90- svg fin_population_by_age svg width 5 height 5 1 2 par mfcol c 1 2 mar c 2 1 2 2 1 2 y <- barplot -m space 0 horiz T xlim c -210000 0 axes F yaxs i col steelblue3 title main miehet cex 8 axis 1 at -4 0 50000 labels c 200 000 100 000 0 barplot w space 0 horiz T axes F yaxs i col steelblue1 axis 1 at 0 4 50000 labels c 0 100 000 200 000 title main naiset cex 8 axis 2 at y labels a tick F las 1 line 1 hadj 5 dev off </pre> cc-zero Uploaded with UploadWizard Population pyramids of Finland | ||||