MAKE A MEME
View Large Image

| View Original: | PrevalenceOverweightAge6-19.GIF (720x540) | |||
| Download: | Original | Medium | Small | Thumb |
| Courtesy of: | commons.wikimedia.org | More Like This | ||
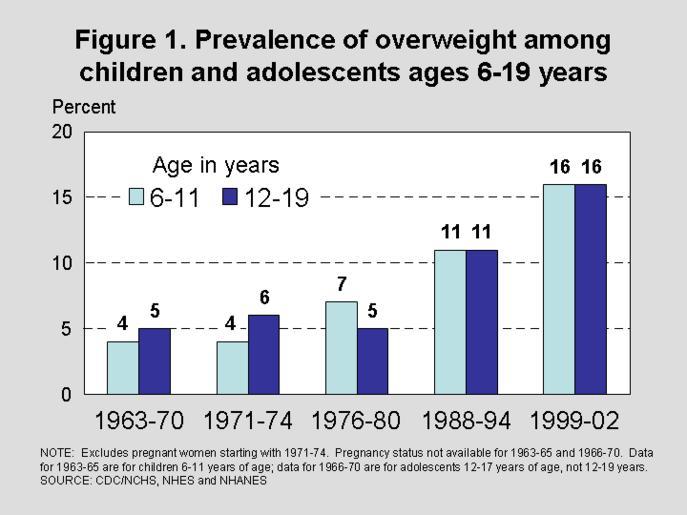
| Keywords: PrevalenceOverweightAge6-19.GIF This is a diagram depicting the rise of overweight among ages 6-19 in the US http //www cdc gov/nchs/products/pubs/pubd/hestats/overfig1 GIF 2005-07-03 Deborah Cragun PD-USGov PD-USGov Obesity statistics for the United States Sociological bar charts | ||||