MAKE A MEME
View Large Image

| View Original: | Probit plot.png (640x480) | |||
| Download: | Original | Medium | Small | Thumb |
| Courtesy of: | commons.wikimedia.org | More Like This | ||
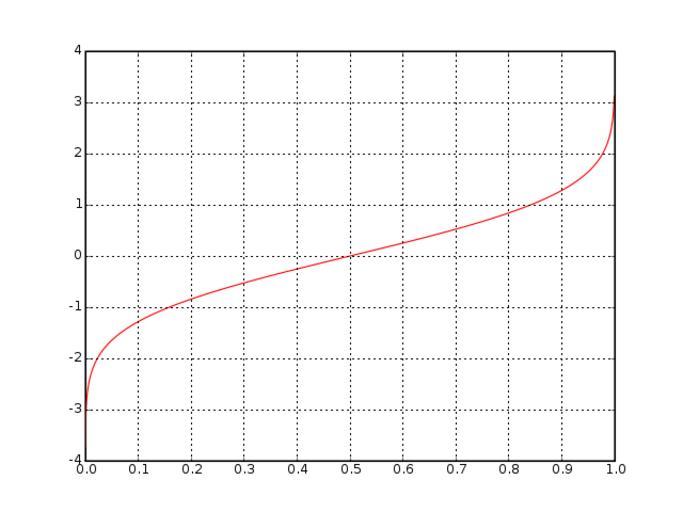
| Keywords: Probit plot.png <br> Plot of the probit function <math>\sqrt 2 \ \operatorname erf -1 2p-1 </math> I created this image myself with the following Python code Images with Python source code <pre> from matplotlib pylab import from scipy special import erfinv def probit p return sqrt 2 erfinv 2 p-1 x_i arange 0 0001 0 9999 0 001 plot x_i probit x_i 'r' xlabel 'probability' ylabel 'probit' grid True xticks arange 0 11 /10 0 savefig 'image png' dpi 80 </pre> http //en wikipedia org/wiki/File Probit_plot png 2006-07-23 and 2007-01-12 http //en wikipedia org/w/index php title Special Log page File Probit_plot png log Coffee2theorems talk Coffee2theorems Created with Matplotlib Math images that should use vector graphics Statistical charts | ||||