MAKE A MEME
View Large Image

| View Original: | Quadratic interpolation.svg (752x564) | |||
| Download: | Original | Medium | Small | Thumb |
| Courtesy of: | commons.wikimedia.org | More Like This | ||
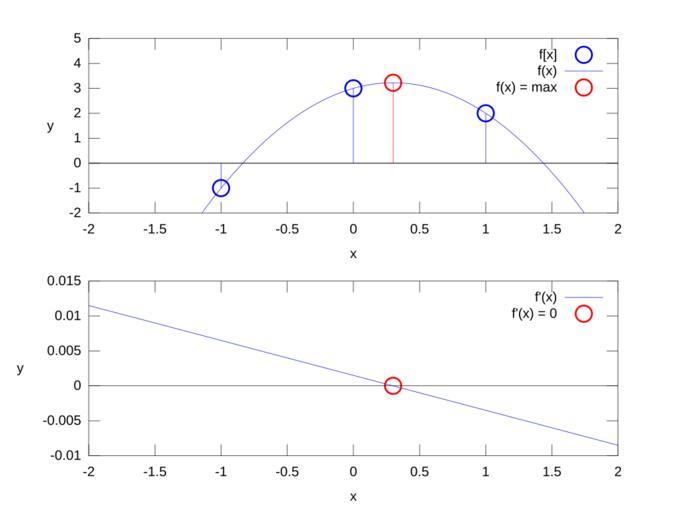
| Keywords: Quadratic interpolation.svg example of quadratic interpolation own 2010-03-07 User DaBler Source code Plotted in GNU Octave <source lang matlab > clear; figure 1 ; subplot 211 ; hold off; x -1 0 1; y -1 3 2; stem x y ; hold on; a y 1 -2 y 2 +y 3 /2; b y 3 -y 1 /2; c y 2 ; t -2000 +2000 /1000; p a t t+b t+c; plot t p ; t_max -b/2/a; p_max a t_max t_max+b t_max+c; h stem t_max p_max r ; ylim -2 5 ; xlim -2 2 legend fx f x f x max xlabel x ; ylabel y Rotation 0 ; subplot 212 ; hold off; plot t 1 end-1 diff p 1 ; hold on; h stem t_max 0 r ; xlim -2 2 legend f' x f' x 0 xlabel x ; ylabel y Rotation 0 ; print quadratic_interpolation svg ; </source> Interpolation GNU Octave diagrams Images with Octave source code | ||||