MAKE A MEME
View Large Image

| View Original: | R-horsekick totals-quantileplot+quartiles.svg (288x288) | |||
| Download: | Original | Medium | Small | Thumb |
| Courtesy of: | commons.wikimedia.org | More Like This | ||
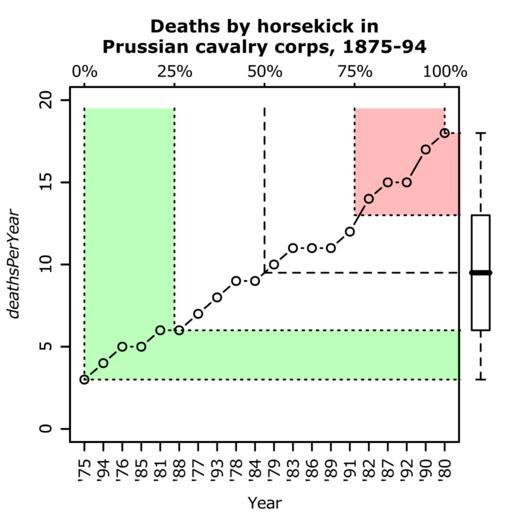
| Keywords: R-horsekick totals-quantileplot+quartiles.svg en Basic quantile plot example with quartiles marked in colour shading and corresponding boxplot Data von Bortkiewicz's famous dataset of deaths by horse kick in Prussian cavalry corps Own HYanWong 2009-03-06 Created with R using the following commands <pre> svg file R-horsekick_totals-quantileplot+quartiles svg width 4 height 4 pointsize 8 Basic quantile plot example with quartiles marked in colour shading and corresponding boxplot Data von Bortkiewicz's famous dataset of deaths by horse kick in Prussian cavalry corps library pscl par mar c 4 4 5 3 +0 1 draw quantile <- function data x x2 NULL border NA draw a line down then across If x2 exists fill between the quantiles y <- quantile data x type 5 ymax <- max data +diff range data 0 1 xmax <- 1 1 if is null x2 segments x ymax x y segments x y xmax y else y2 <- quantile data x2 type 5 mapply function X1 X2 Y1 Y2 border polygon c X1 X1 xmax xmax X2 X2 c ymax Y1 Y1 Y2 Y2 ymax border border x x2 y y2 border X <- tapply prussian y prussian year sum plot NA ylim c 0 20 xlim 0 1 xaxt n xlab Year ylab expression italic deathsPerYear draw quantile X 0 0 25 col 00FF0044 draw quantile X 0 75 1 col FF000044 draw quantile X 0 4/4 lty c 3 3 2 3 3 points seq 0 1 length length X sort X type b axis 3 0 4/4 paste 0 4/4 100 sep tcl -0 2 mgp c 0 5 0 5 0 axis 1 seq 0 1 length length X paste ' names sort X sep las 3 par no readonly T -> par par xpd NA boxplot X add TRUE at 1 1 boxwex 0 1 par par title Deaths by horsekick in\nPrussian cavalry corps 1875-94 line 2 dev off </pre> Uncategorized 2015 March 23 | ||||