MAKE A MEME
View Large Image

| View Original: | Sine cosine integral.svg (100x100) | |||
| Download: | Original | Medium | Small | Thumb |
| Courtesy of: | commons.wikimedia.org | More Like This | ||
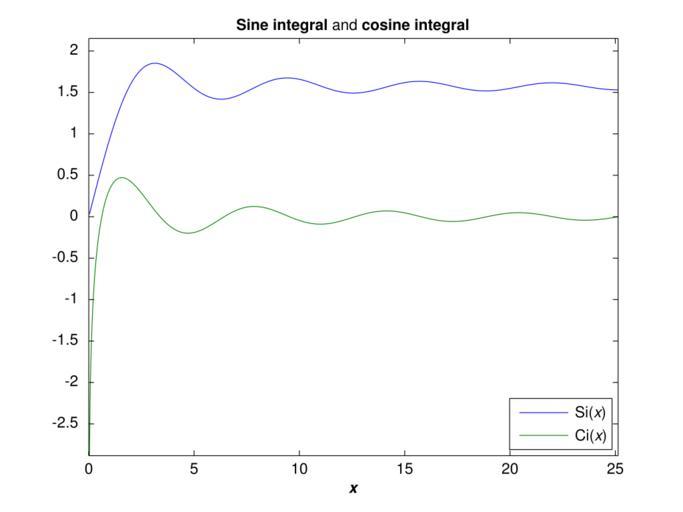
| Keywords: Sine cosine integral.svg sine integral and cosine integral functions for <math>0 < x \le 8\pi</math> The plot was produced by the following MATLAB code <source lang matlab > x 0 0 01 pi 8 pi; Si sinint x ; Ci cosint x ; requires Symbolix Math Toolbox plot x Si x Ci ; margin 0 3; axis min x max x min min Si min Ci max max Si max Ci + margin title ' \bfSine integral and \bfcosine integral ' ; legend 'Si \itx ' 'Ci \itx ' 'Location' 'SouthEast' xlabel ' \it \bfx ' </source> The plot was converted to SVG using the http //www mathworks com/matlabcentral/fileexchange/7401 plot2svg function from MATLAB Central Own DmitTrix 2009-03-31 Check categories 2009 April 1 en wikipedia Trigonometric_integral 4 Integral functions | ||||