MAKE A MEME
View Large Image

| View Original: | Sinh cosh tanh.svg (504x504) | |||
| Download: | Original | Medium | Small | Thumb |
| Courtesy of: | commons.wikimedia.org | More Like This | ||
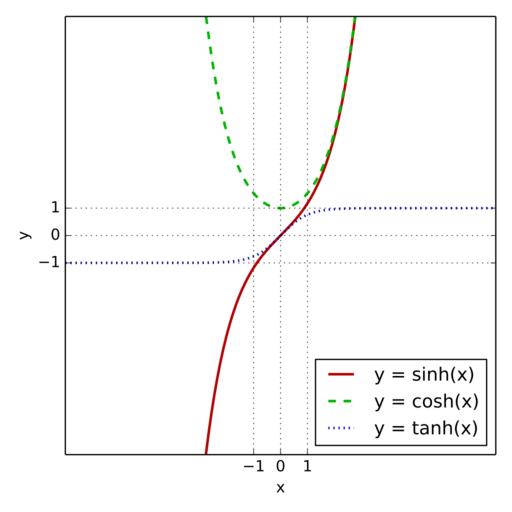
| Keywords: Sinh cosh tanh.svg The hyperbolic sine red hyperbolic cosine green and hyperbolic tangent blue graphed on the same axes Replaces en Image sinh cosh tanh png ;Instructions Generated with en Matplotlib using the script below Edited using en Inkscape to fix clipping issues Other fields Matplotlib + import numpy as np import matplotlib pyplot as plt lim 8 size 5 6 fig ax plt subplots figsize size size xs np linspace -lim lim 1000 ax plot xs np sinh xs label y sinh x color b30000 linestyle - linewidth 2 ax plot xs np cosh xs label y cosh x color 00b300 linestyle -- linewidth 2 ax plot xs np tanh xs label y tanh x color 0000b3 linestyle linewidth 2 ax set_xlim -lim lim ax set_ylim -lim lim ax set_xticks -1 0 1 ax set_yticks -1 0 1 ax set_xlabel x ax set_ylabel y ax grid on ax legend loc lower right fig tight_layout fig savefig sinh_cosh_tanh svg transparent True 2016-03-10 own Fylwind wikipedia en original upload log page en wikipedia Sinh_cosh_tanh svg 2006-03-14 10 22 Ktims 1600×1200×0 8934 bytes The hyperbolic sine red hyperbolic cosine green and hyperbolic tangent blue graphed on the same axes 2006-03-14 10 21 Ktims 1600×1200×0 8965 bytes The hyperbolic sine red hyperbolic cosine green and hyperbolic tangent blue graphed on the same axes 2006-03-14 10 15 Ktims 1600×1200×0 8967 bytes The hyperbolic sine red hyperbolic cosine green and hyperbolic tangent blue graphed on the same axes 2006-03-14 10 15 Ktims 1600×1200×0 8980 bytes The hyperbolic sine red hyperbolic cosine green and hyperbolic tangent blue graphed on the same axes 2006-03-14 10 14 Ktims 1600×1200×0 8902 bytes The hyperbolic sine red hyperbolic cosine green and hyperbolic tangent blue graphed on the same axes Images with Gnuplot source code Hyperbolic functions | ||||