MAKE A MEME
View Large Image

| View Original: | Tangent.svg (1600x1300) | |||
| Download: | Original | Medium | Small | Thumb |
| Courtesy of: | commons.wikimedia.org | More Like This | ||
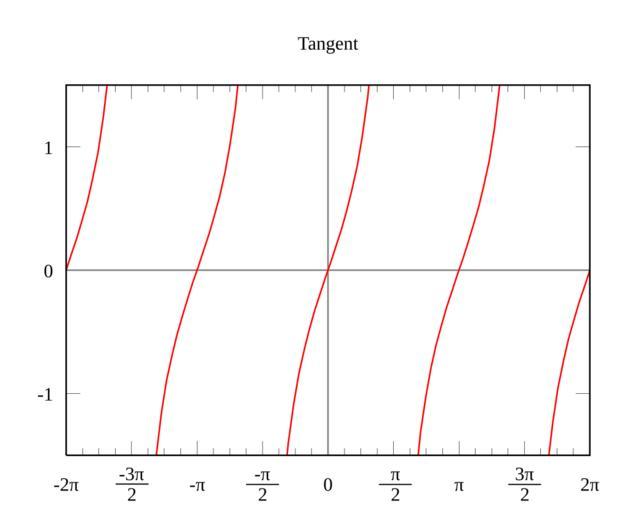
| Keywords: Tangent.svg A graph of the tangent function on the interval -2Ï 2Ï 2006-03-21 own assumed Ktims Instructions Generated with the following gnuplot script then touched up and reannotated in Inkscape <pre> set terminal svg size 1600 1300 fname Times New Roman fsize 48 set output tangent svg set nokey set xtics pi/2 set mxtics 4 set ytics 1 set nogrid set xzeroaxis set yzeroaxis set title Tangent set xrange -2 pi 2 pi set yrange -1 5 1 5 plot tan x lw 4 </pre> Tangent function Images with Gnuplot source code | ||||