MAKE A MEME
View Large Image
| View Original: | Trials in US District Courts(Criminal)Criminal.JPG (772x525) | |||
| Download: | Original | Medium | Small | Thumb |
| Courtesy of: | commons.wikimedia.org | More Like This | ||
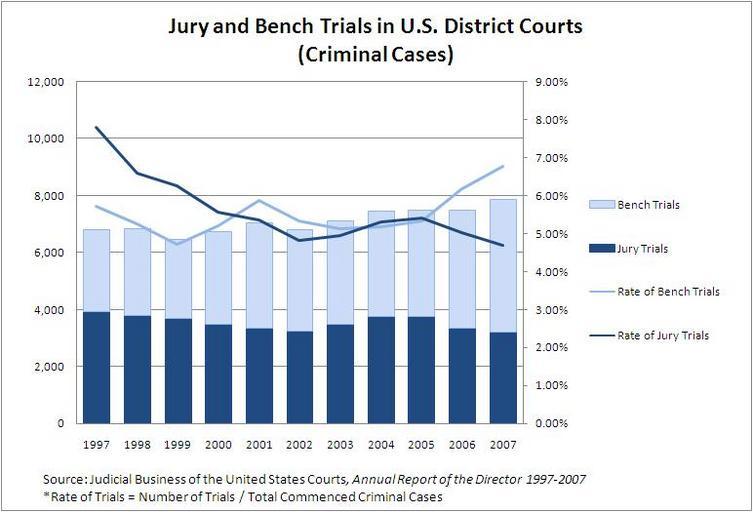
| Keywords: Trials in US District Courts(Criminal)Criminal.JPG en This graph indicates 1 numbers of jury and bench trials at criminal cases and 2 their rates against the total commenced criminal cases during the year in the U S federal district courts Numbers of trials are adopted from Tables C-7 of http //www uscourts gov/judbususc/judbus html Annual Report of the Director Numbers of total criminal commenced cases are adopted from Tables D-1 Cases A year indicates 12 months ending on September 30 e g 1997 means from October 1996 to September 1997 ja ŃüōŃü«Ńé░Ńā®ŃāĢŃü»Ń üŃéóŃāĪŃā¬Ńé½ķ Żķé”Õ ░µ¢╣ĶŻüÕłżµē Ńü½ŃüŖŃüæŃéŗ 1 Õłæõ║ŗõ║ŗõ╗ČŃü«ķÖ¬Õ»®ÕÅŖŃü│ĶŻüÕłżÕ«śŃü½ŃéłŃéŗŃāłŃā®ŃéżŃéóŃā½Ńü«õ╗ȵĢ░Ńü©Ń ü 2 Ńü Ńü«ŃāłŃā®ŃéżŃéóŃā½õ╗ȵĢ░Ńü«Ń üÕÉīŃüśÕ╣┤Ńü«Õģ©Õłæõ║ŗõ║ŗõ╗ČŃü«µ¢░ÕÅŚõ╗ȵĢ░Ńü½Õ»ŠŃüÖŃéŗÕē▓ÕÉłŃéÆńż║ŃüÖŃééŃü«Ń éŃāłŃā®ŃéżŃéóŃā½õ╗ȵĢ░Ńü»http //www uscourts gov/judbususc/judbus html Annual Report of the DirectorŃü«ÕÉäÕ╣┤Ńü«Table C-7ŃüŗŃéēÕÅ¢ŃéŖŃ üÕłæõ║ŗõ║ŗõ╗ČŃü«µ¢░ÕÅŚõ╗ȵĢ░Ńü»ÕÉīŃüśŃüÅTable C-1ŃüŗŃéēÕÅ¢ŃüŻŃü¤Ń é1Õ╣┤Ńü»9µ ł30µŚźŃüŠŃü¦Ńü«12Ńüŗµ łŃéƵīćŃüÖŃ éõŠŗŃüłŃü░Ń ü1997Ńü©ŃüéŃéŗŃü«Ńü»1996Õ╣┤10µ łŃüŗŃéē1997Õ╣┤11µ łŃüŠŃü¦Ńü«ŃüōŃü©Ń é Data from http //www uscourts gov/judbususc/judbus html Annual Report of the Director by Judicial Business of the United States Courts Graph drawn by me 2008-10-04 Juries | ||||
Criminal.JPG)