MAKE A MEME
View Large Image

| View Original: | US_timeline._Prescription_opioid_pain_reliever_deaths.jpg (835x592) | |||
| Download: | Original | Medium | Small | Thumb |
| Courtesy of: | commons.wikimedia.org | More Like This | ||
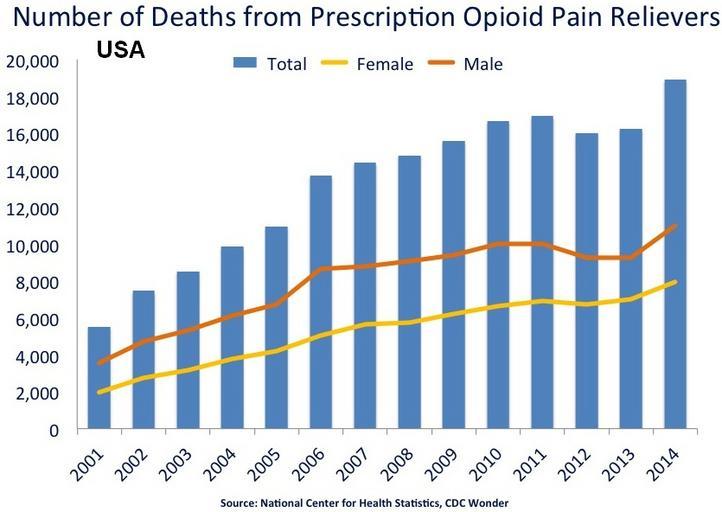
| Keywords: US timeline. Prescription opioid pain reliever deaths.jpg en National Overdose Deaths ”Number of Deaths from Prescription Opioid Pain Relievers The figure above is a bar chart showing the total number of U S overdose deaths involving opioid pain relievers from 2001 to 2014 The chart is overlayed by a line graph showing the number of deaths by females and males From 2001 to 2014 there was a 3 4-fold increase in the total number of deaths 2015-12-29 - date of original upload here of adapted chart https //d14rmgtrwzf5a cloudfront net/sites/default/files/cdc-us-overdose-deaths-2014_jr-2 jpg Chart from http //www drugabuse gov/related-topics/trends-statistics/overdose-death-rates Overdose Death Rates By National Institute on Drug Abuse NIDA National Institute on Drug Abuse And User Timeshifter I cropped the original chart and added USA to it I put the adapted chart under the same public domain license --Timeshifter <span class signature-talk ></span> 07 22 29 December 2015 UTC other versions PD-USGov Drug-related death statistics Uploaded with UploadWizard | ||||