MAKE A MEME
View Large Image

| View Original: | USHouseStructure2012-2022 SeatsByState.png (2000x1053) | |||
| Download: | Original | Medium | Small | Thumb |
| Courtesy of: | commons.wikimedia.org | More Like This | ||
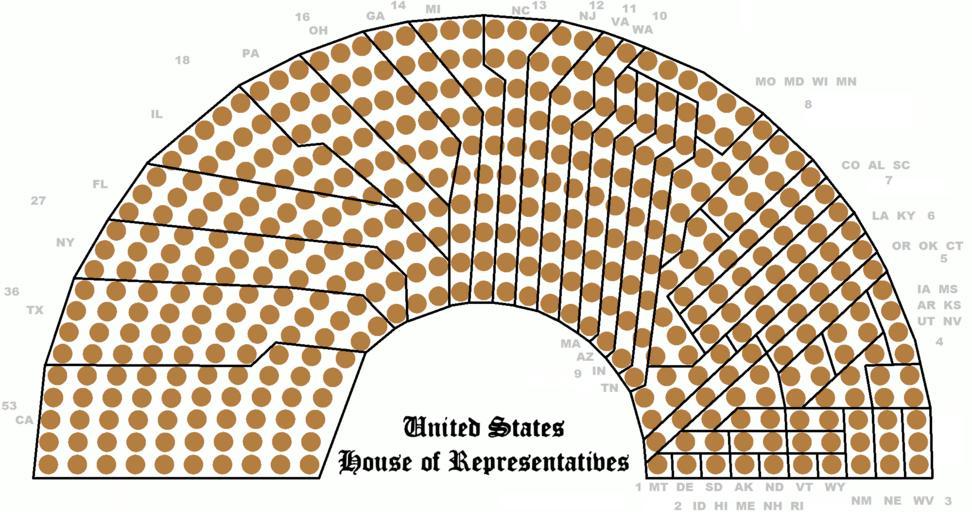
| Keywords: USHouseStructure2012-2022 SeatsByState.png US House of Representatives showing all 435 voting seats grouped by state Largest-to-smallest states are shown in a generally left-to-right clockwise flow - The 9 largest states have a majority of the seats/votes with the other 41 having less than half - The four largest states CA TX NY FL have more combined votes than 34 of the smallest states - California by itself has more votes than 21 of the smallest states combined - Texas by itself has more votes than 17 of the smallest states put together These facts can be understood as a straightforward matter of larger populations requiring a greater number of seats to represent them per the principles of representative democracy What this image also illuminates is the converse situation the problem of the Senate where states are given two votes each regardless of the number of people that a single Senator represents At the time the Senate was created the most populous state Virginia had roughly 10 times as many people as the least populous state Delaware This imbalance has been greatly magnified to the current situation where the most populous state today California has nearly 70 times as many people as the least populous state Wyoming See Malapportionment Seat apportionment presented in this diagram can be verified at this table 2013-10-06 22 19 37 File 112USHouseStructure svg ChrisnHouston cc-zero Uploaded with UploadWizard Election apportionment diagrams of the United States House of Representatives | ||||