MAKE A MEME
View Large Image
| View Original: | U.S. Births by Time of Day.svg (611x454) | |||
| Download: | Original | Medium | Small | Thumb |
| Courtesy of: | commons.wikimedia.org | More Like This | ||
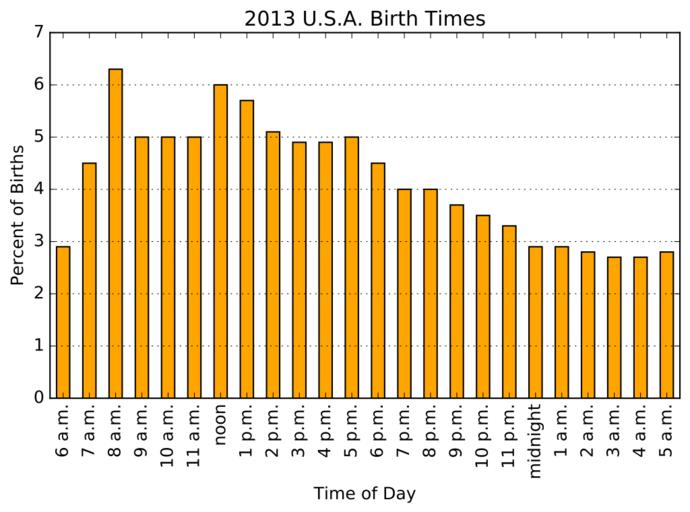
| Keywords: U.S. Births by Time of Day.svg en A graph showing births in the U S per hour This data is from the http //www cdc gov/nchs/data/databriefs/db200 htm U S CDC for the year 2013 When Are Babies Born Morning Noon or Night Birth Certificate Data for 2013 NCHS Data Brief No 200 May 2015 T J Mathews M S ; and Sally C Curtin M A Key findings Data from the National Vital Statistics System The highest percentages of births occurred during the morning and midday hours Births on Saturday and Sunday were more likely to occur in the late evening and early morning hours than births Monday through Friday Compared with induced vaginal deliveries and noninduced vaginal deliveries cesarean deliveries were the least likely to occur during the evening and early morning Noninduced vaginal births were more likely than cesarean and induced vaginal births to occur in the early morning Cesarean deliveries with no trial of labor were much more concentrated during the day than were cesarean deliveries with a trial of labor Births delivered in hospitals and all births show similar time-of-day patterns As the use of medical interventions for childbirth i e induction of labor and cesarean delivery has increased during the last few decades an increasing proportion of deliveries occur during regular daytime hours Hospital personnel resources and maternal and newborn outcomes can be influenced by the time of day of delivery Data on the time of day of the birth became available with the 2003 revision of the birth certificate This report examines 2013 birth certificate data from the National Vital Statistics System NVSS to describe the time of day of birth by method of delivery and place of birth for a 41-state and District of Columbia DC reporting area that had adopted the 2003 revised birth certificate by January 2013 This reporting area represents 90 of U S births 2016-06-09 own Douglas Perkins other versions Code <pre> /usr/bin/env python from matplotlib import pyplot from matplotlib import ticker from matplotlib import numpy This generates a bar graph showing births by time of day Data is from the U S CDC for the year 2013 For simplicity I have rounded it here http //www cdc gov/nchs/data/databriefs/db200 htm This file was written by Douglas Perkins data 6 a m 2 9 7 a m 4 5 8 a m 6 3 9 a m 5 0 10 a m 5 0 11 a m 5 0 noon 6 0 1 p m 5 7 2 p m 5 1 3 p m 4 9 4 p m 4 9 5 p m 5 0 6 p m 4 5 7 p m 4 0 8 p m 4 0 9 p m 3 7 10 p m 3 5 11 p m 3 3 midnight 2 9 1 a m 2 9 2 a m 2 8 3 a m 2 7 4 a m 2 7 5 a m 2 8 times d0 for d in data births d1 for d in data Make a graph x numpy arange len times + 0 25 width 0 5 pyplot figure num 1 figsize 8 4 5 pyplot bar x births width color 'orange' pyplot title '2013 U S A Birth Times' pyplot ylabel 'Percent of Births' pyplot xlabel 'Time of Day' xticks pyplot xticks x + width/2 0 times rotation 'vertical' pyplot subplot 111 grid b True axis 'y' pyplot subplot 111 set_xlim 0 24 pyplot savefig 'Chapter 6 Birth Times svg' format 'svg' bbox_inches 'tight' </pre> cc-zero Birthdays | ||||